Success partner for your global takeoff,
The Global Network of Korea Eximbank.

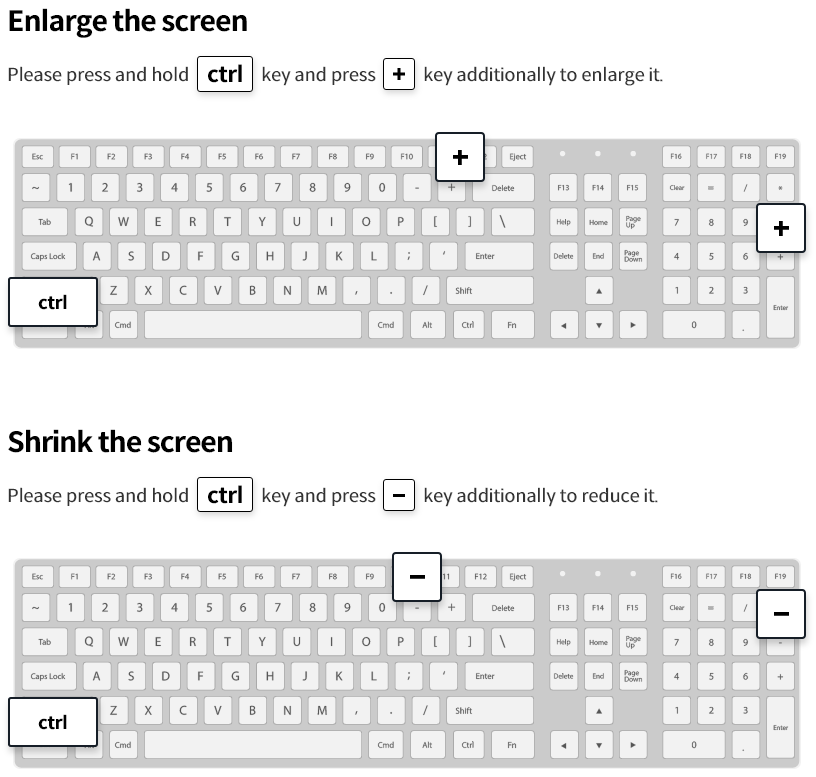
How to enlarge/reduce the letter size

Enlarge the screen : Please press and hold ctrl key and press + key additionally to enlarge it. Shrink the screen : Please press and hold ctrl key and press - key additionally to reduce it.

E-Mail this

Did you find useful information at KEXIM?
Recommend the information you see now to anyone you want to share with.
After entering the following details, you can share contents by clicking "SEND"

@
@

FUNDING RESOURCES

EDCF funding resources are consist of contributions from the government's general budget account, borrowings from the government's special budget account and profit earned from the operation of the fund.

The initial contribution of 30.0 billion Won from the government was made in 1987 and the government continued yearly contributions since then.

Excel Download 

(Unit : KRW Million)

FUNDING RESOURCES
Year Government Contributions Long-term Borrowings Long-term Borrowings Repayment Net Profit Others* Total
Total 7,706,506 1,526,140 617,140 -984,108 7,631,398
1987 30,000 - - 866 30,866
1988 20,000 - - 4,771 24,771
1989 50,000 40,000 - 9,263 99,263
1990 10,000 - - 25,728 35,728
1991 10,000 50,000 - 39,476 99,476
1992 - 10,000 - 64,102 74,102
1993 19,870 10,000 - 33,220 63,090
1994 85,000 20,000 - 33,629 138,629
1995 120,000 70,000 2,670 43,903 231,233
1996 130,000 70,000 4,002 62,784 258,783
1997 55,000 35,000 6,000 85,088 169,088
1998 - - 6,670 109,679 103,009
1999 - - 7,336 51,735 44,399
2000 - - 8,668 56,670 48,002
2001 - - 13,336 47,227 33,891
2002 - - 18,002 36,614 18,611
2003 80,000 - 20,334 32,787 92,454
2004 70,000 - 20,332 35,400 85,069
2005 100,000 - 20,332 28,499 108,168
2006 150,000 - 20,332 35,520 165,189
2007 170,000 - 20,332 43,365 193,034
2008 160,000 - 20,332 49,493 189,161
2009 120,000 - 20,332 64,212 163,880
2010 150,000 - 17,665 41,228 173,562
2011 350,000 - 40,996 -97,425 -53,847 157,732
2012 298,975 150,000 7,000 -114,689 327,287
2013 310,000 162,140 7,000 -208,836 256,304
2014 458,958 - 7,000 -207,598 244,360
2015 766,415 - 7,000 -218,812 540,604
2016 610,000 - 7,000 -167,768 435,232
2017 590,000 - 2,333 -189,920 397,747
2018 671,322 12,000 - -201,520 481,802
2019 779,990 272,000 150,000 -178,061 723,929
2020 588,058 325,000 162,140 -208,351 542,567
2021 752,918 300,000 - -172,540 880,378

* The loss related to the cost for subsidized loans of 2010 year